citizen development
What is citizen development?
Citizen development is a business process that encourages non-IT-trained employees to become software developers, using IT-sanctioned low-code/no-code (LCNC) platforms to create business applications. This approach to software development empowers employees -- despite their lack of formal education in coding -- to become citizen developers. They create and customize existing software programs to suit a user's specific needs and improve operational efficiency within a company.
LCNC platforms include the necessary lines of code so users can drag and drop icons to create and update applications. Simple visual process automation tools allow different application functions to connect components across business units, apply actions, test to make sure the programming works as expected and publish the new code.
What are citizen developers?
Citizen developers are empowered business users who create new or change existing business applications without the need to involve IT departments. Citizen developers are likely to be more agile than IT developers and can respond quickly to changes in the business landscape.
In the past, employees seeking even the smallest project faced frustration as their request waited for overburdened developers to get to it. This process could sometimes take months. During that wait, internal business priorities most likely changed, the business's competition continued to adapt, and new business problems emerged.
Citizen development initiatives can be an important part of digital transformation activities. Digital transformation projects can lead to development backlogs because IT teams have so many other primary tasks. A citizen development program helps organizations going through digital transformations streamline development initiatives and keep up with development demands.
Successful citizen development approaches not only speed innovation and the app development process but also reduce IT backlogs and free IT personnel to prioritize and address more pressing business needs. This approach prevents security problems associated with shadow IT and third-party apps through transparency, workflow management, and resource sharing and monitoring among citizen developers and IT professionals.
The need for citizen development
Businesses that devote time and resources to creating a citizen development community have seen an increase in efficiency and productivity. Previously, they wasted time waiting for IT personnel to solve problems that required application development work. Citizen developers can take on some of those tasks. They have become standard practice at many companies engaged in application creation.
Any employee who learns and understands the application of LCNC platforms can use it as a software developer or share that knowledge with a fellow employee. As the citizen developer community grows, organizations embracing the technology and associated processes are likely to realize operational efficiency increases.
Who is a candidate for citizen development?
Employees with an interest in citizen development probably have to spend time learning LCNC programming. It might be necessary to free up time that would otherwise go to existing project deliverables, attendance at meetings and other regular job activities.
Coordination with human resources is likely needed as well as support from IT employees overseeing the citizen development program. These two organizations will be involved in the screening process to select good citizen developer candidates.
Prospective citizen developers should be knowledgeable in the business processes and requirements to be addressed during their programming assignments. It might be necessary to designate space, such as a conference room, for these developers to work. They might also do all or some of their work at their normal workstation or even remotely but might benefit from a collaborative work environment.
Pros and cons of citizen development
The argument for or against citizen development depends on the time these projects will take, available talent and business requirements. The need for business applications will continue to increase. The question is whether experienced employees without IT training can produce applications that will meet the needs of end users faster than IT professionals. The latter can write complicated code but might lack the expertise, understanding or interest of a targeted end user.
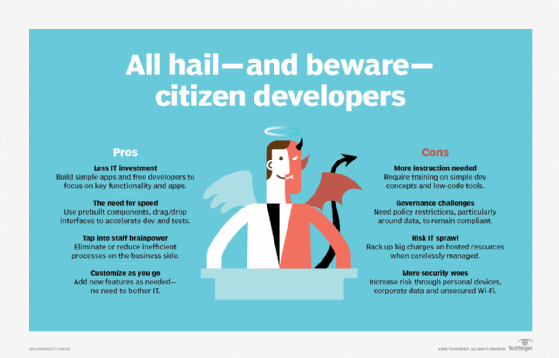
Advantages of citizen development
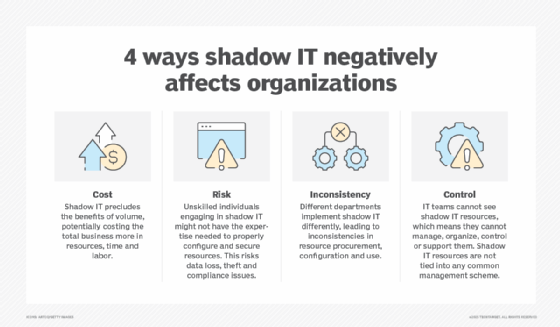
- Reduces burden on IT. With the constant growth of applications and the regular need for troubleshooting existing apps, IT departments face difficult, mounting issues. LCNC-based citizen development platforms ease the app creation responsibilities of IT developers, letting those employees handle other work. An IT department that isn't overwhelmed with requests can also monitor the risks and rewards of citizen development, including the necessary integrations and permissions required for an app to succeed.
- Cost-effective. Citizen development creates a larger pool of employees who can share resources and development tools. This approach reduces the need for IT professionals and the costs associated with their work, while enhancing the technical understanding of everyone in the citizen developer community.
- Increases productivity and efficiency. A focus on collaboration and speed improves efficiency and productivity. LCNC platforms use existing code to speed up the creation of apps. Their ease of use helps users make changes faster.
Disadvantages
- Constantly changing technology. With constant updates to applications and programs, consistent training and retraining of citizen developers is needed to keep pace. Most citizen developers, especially those new to this business process, require guidance in becoming software developers.
- Quality issues. A lower-quality product can result if IT doesn't carefully oversee citizen developers' work. Professional developers must actively participate in the citizen development process to ensure quality and functionality. This includes everything from the development effort to testing to the final product and its security.
- Administrative considerations. How to compensate citizen developers is a question that comes up. Should their salary be increased to account for their work as a developer? Should they be designated IT employees, or do they remain in their existing departments? All these considerations will need business leader and senior management approval and must be included in budget and operations planning.
Professional developer vs. citizen developer
Citizen development grew from business analysts' realizations that too much responsibility was placed on professional developers. They were required to both create new applications and troubleshoot existing applications. Most IT departments had a backlog of development requests, and projects could languish for months waiting to be worked on.
LCNC platforms now enable employees with no professional development experience -- citizen developers -- to create applications for fellow employees and customers. Citizen developers are more immersed in their part of the business than developers in the IT department. As a result, the apps they build and maintain are more likely to reflect the needs of users.
Citizen development is here to stay and will continue to expand its role in application development. Businesses must, therefore, strike a balance between the speed and suitability of citizen developers' targeted creations and the security and oversight professional developers provide.
Citizen development tools and resources
Citizen development platforms help companies meet the demands of a changing market. They're sometimes called point-and-click platforms because they're easy to use and reduce the need to code applications. Here are some tools and resources available to the citizen developer community:
- Mendix. This low-code platform is designed to accelerate application delivery and changes without the need for professional IT developers. Mendix 10 offers AI and ML tools and the ability to create mobile apps.
- Microsoft PowerApps. This is a low-code app for everyday users and professionals. It enables app creation without writing code using AI tools and lets professional developers interact with data and metadata and create custom connectors.
- Nocode Essentials. This collection of resources discusses several no-code platforms and low-code development tools and techniques.
- Salesforce Lightning Platform. This customer relationship management giant offers low-code tools through its Lightning Platform. Three editions are available: Platform Starter, Platform Plus and Heroku Enterprise Starter. The platform has AI tools as well as other tools, such as Lightning Object Creator, Lightning Flow Builder, Dynamic Forms and Dynamic Actions.
- Jitterbit Vinyl. This no-code development platform helps users build apps quickly while integrating them with existing systems. Vinyl was originally developed by Zudy, which Jitterbit acquired in March 2023.
Find out more about the risks and rewards of citizen development and the LCNC approach.