The definitive guide to enterprise IT monitoring
This comprehensive IT monitoring guide examines strategies to track systems, from servers to software UIs, and how to choose tools for every monitoring need.

A lack of insight has plagued IT organizations since the earliest days of computing, leading to inefficiency and wasted capital, nagging performance problems and perplexing availability issues that can be costly and time-consuming to resolve. That's why IT monitoring has long been an essential element of any enterprise IT strategy.
IT monitoring is needed to oversee and guide the data center and its constituent applications and services. IT administrators and business leaders track metrics over time to ensure that the IT organization maintains its required level of performance, security and availability, using trends to validate infrastructure updates and changes long before applications and services are affected. At the same time, real-time alerting lets admins respond to immediate problems that could harm the business.
Enterprise IT monitoring uses software-based instrumentation, such as APIs and software agents, to gather operational information about hardware and software across the enterprise infrastructure. Such information can include basic device or application and device health checks, as well as far more detailed metrics that track resource availability and utilization, system and network response times and error rates and alarms.
IT monitoring employs the following three fundamental layers:
- The foundation layer gathers data from the IT environment, often using combinations of agents, logs, APIs or other standardized communication protocols to access data from hardware and software.
- The software layer then processes and analyzes the raw data. From this, the monitoring tools establish trends and generate alarms.
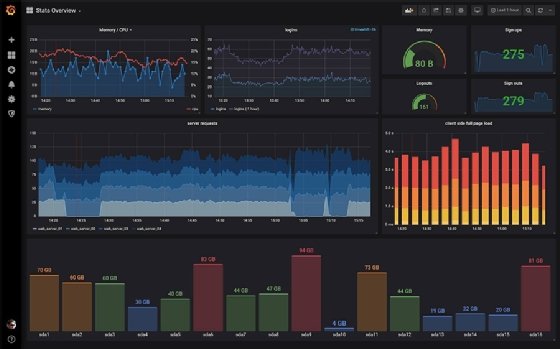
- The interface layer displays the analyzed data in graphs or charts through a GUI dashboard.
What is an IT monitoring strategy?
In simplest terms, an IT monitoring strategy represents the organization's game plan for managing the health, performance and availability of applications and infrastructure. A monitoring strategy defines why monitoring is needed, what needs to be watched and how it needs to be watched. An IT monitoring strategy encompasses four essential levels:
- Goals. This is the "why" of IT monitoring. Monitoring for its own sake is a waste of important resources. An IT monitoring strategy should be built on a meaningful or tangible business purpose. For example, monitoring might be needed to improve application availability, ensure a satisfactory UX or measure revenue per transaction.
- Metrics and KPIs. This is the "what" of IT monitoring. Business and IT leaders can select from a wide array of metrics and KPIs that will help the business meet its goals. Metrics and KPIs can be measured directly or indirectly calculated by performing simple calculations based on other direct measurements.
- Tools. This is the "how" of IT monitoring. Procure or build software tools that can collect, store, process and deliver metrics and KPIs to IT and business leaders. Not all tools are suited to all metrics or KPIs, and many tools provide a high level of customization to accommodate a wide range of environments and use cases. It's important to select the right tools for the job at hand.
- Reporting. More directly, what's going to happen to KPI and metric data once it's collected by tools. This is an important and often overlooked part of the "how" of IT monitoring. Metrics and KPIs aren't an end unto themselves -- simply having all that data offers little value. Tools must collect, process and present data points to IT and business leaders in a form that's clear and actionable. Although reporting is a function of the tool set, it's vital to consider how that data is presented. Some reporting might be tactical or immediate in the form of alerts, while other reporting might be more strategic or trend-related in the form of dashboard summaries.
Monitoring vs. observability
The evolution of IT has introduced a distinction between the concepts of monitoring and observability, and admins will most likely encounter both terms when developing an IT monitoring strategy and selecting suitable tools.
In simplest terms, monitoring is used to collect data and make conclusions about the outputs of an application, service or device. For example, it's a simple matter to measure the bandwidth utilization of a network segment and report that as a percentage of available bandwidth.
Observability has a deeper meaning, encompassing the collection, processing and reporting of data points that can provide a more detailed and holistic picture of the environment's behavior -- and more effectively pinpoint potential problems. With the bandwidth example, observability might deliver a more detailed picture of workloads and services consuming the available bandwidth on that network segment.
For the purposes of this guide, the needs and factors that drive monitoring and observability are identical. The concept of an IT monitoring strategy can entail both monitoring and observability.
Why is having an IT monitoring strategy important?
An IT monitoring strategy is a cornerstone of IT operations. Because almost every modern enterprise derives revenue from applications and data running on an IT infrastructure, it's essential for the business to know that those applications, data sets and underlying infrastructure are all working within acceptable parameters. IT monitoring lets the business remediate -- even prevent -- problems that can affect customer satisfaction and revenue.
An IT monitoring strategy is the high-tech equivalent of quality control (QC) in a traditional factory.
Consider a traditional factory in the business of manufacturing a physical product for sale. The business implements a QC activity that evaluates the suitability of raw materials, gauges the functionality and quality of each production machine's output and validates the final product against physical dimensions, functional behavior or other parameters.
Traditional QC is responsible for making sure that the company is manufacturing quality products that operate properly and are visually and functionally suitable for sale. Without QC, the company has no objective means of measuring the quality or suitability of the products being manufactured. Quality products make for happier customers and fewer returns.
IT monitoring is closely analogous to its physical counterpart. IT monitoring can ensure that applications are available and healthy, related data stores are available and valid and that all the supporting servers, storage, networking and services are functioning normally -- all with the goal of delivering applications and data to users.
When an application crashes, performs poorly, can't access data or becomes otherwise unavailable, customer satisfaction and revenue falls, costly time and effort is spent troubleshooting and the business might even face regulatory consequences. Without IT monitoring, the business has no objective means of knowing how well applications are working until help requests start flooding in. IT monitoring, and the strategies adopted to implement that monitoring, are essential for the business to have objective insights into its operations and consequences to revenue. In many cases, proper IT monitoring can even mitigate potential problems before they manifest to the user.
Types of IT monitoring
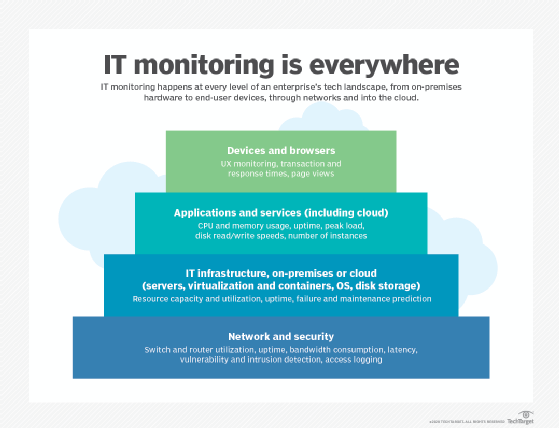
Although the need for IT monitoring is ubiquitous, monitoring approaches have proliferated and diversified through the years. This has yielded an array of strategies and tools focused on specific aspects of monitoring: IT infrastructure, public cloud, networking, security and application and UX.
IT infrastructure monitoring
The traditional foundation of compute infrastructure lies in an organization's local data center environment: fleets of physical and virtual servers as well as storage assets such as local disks and disk arrays. Server monitoring discovers and classifies the existing assets, including hardware, OSes and drivers, and then collects and processes a series of metrics.
Metrics can track physical and virtual server availability -- uptime -- and performance, and measure resource capacity, such as processor core availability and clock usage, memory capacity and utilization, disk storage and any associated storage area network.
Monitoring can also check and enforce system configurations to ensure uniformity and security. By watching capacity metrics, a business can find unavailable, unused or underutilized resources and make informed predictions about when and how much to upgrade.
Metrics also let admins oversee benchmarks that gauge actual vs. normal compute performance from which they can immediately identify and correct infrastructure failures. Changes in performance trends over time also might indicate potential future compute problems, such as over-stressed servers.
Public cloud infrastructure monitoring
As organizations expand off-premises compute environments, infrastructure monitoring has expanded to include remote and cloud infrastructures. Although cloud monitoring has some limitations, IaaS providers often allow infrastructure visibility down to the server and OS level, including processors, memory and storage. Some native tools let IT managers dig into the details of log data. Still, public cloud infrastructures are shrouded by a virtualization layer that conceals the provider's underlying physical assets. Cloud providers offer native monitoring tools, and third-party tools are available for multi-cloud environments.
Network monitoring
Servers and storage have little value without a LAN and WAN to connect them, so network monitoring has evolved as an important IT monitoring type. Unique devices and services in the network, including switches, routers, firewalls and gateways, rely on APIs and common communication protocols to provide details about configuration, such as routing and forwarding tables. Monitoring tools yield network performance metrics -- such as uptime, errors, bandwidth consumption and latency -- across all the subnets of a complex LAN. It's challenging to find a single network monitoring tool to cover all network devices and process network metrics into meaningful intelligence.
Another reason network monitoring is a separate branch of the IT monitoring tree is security. A network is the road system that carries data around an enterprise and to its users. It's also the principal avenue for attack on the organization's servers and storage. That makes it essential to have an array of network security tools for intrusion detection and prevention, vulnerability monitoring and access logging. The notion of continuous security monitoring relies on automation. It promises real-time, end-to-end oversight of the security environment, alerting security teams to potential breaches.
Security monitoring
Beyond performance and availability, security has become a principal goal for IT monitoring strategies. Security is vital for protecting business data and helping strengthen the organization's compliance and governance posture. Security has many aspects, such as the following:
- Authentication and authorization to ensure that only the right users have access to the right resources and services.
- Intrusion detection and alerting to watch for unusual network, application and storage traffic.
- Checking and preventing malware such as viruses, spyware and ransomware.
- Setting and enforcing a prescribed configuration environment to ensure that systems and applications operate within known, well-defined infrastructure for security and compliance -- usually part of a broader change management process.
Security monitoring might require different tools to cover each aspect. For example, one tool might handle intrusion detection and prevention, while another tool might handle authentication and authorization monitoring.
Application and user experience monitoring
Even an infrastructure and network that work perfectly might provide inadequate support for demanding applications, leaving users frustrated and dissatisfied. This potentially leads to wasted investment and lost business. Ultimately, it's availability and performance of the workload -- not the infrastructure -- that really matters to users. This has led to two relatively recent expressions of IT monitoring: application performance monitoring (APM) and UX monitoring.
APM typically uses traditional infrastructure and network monitoring tools to assess the underlying behaviors of the application's environment, but it also gathers metrics specifically related to application performance. These can include average latency, latency under peak load and bottleneck data such as delays accessing an essential database or the time it takes to service a user's request.
An organization that demonstrates how an application performs within acceptable parameters and operates as expected can strengthen its governance posture. When an application's performance deviates from acceptable parameters, leaders can remediate problems quickly -- often without users ever knowing a problem existed.
APM took root in local data centers, but public cloud providers offer support tools -- such as Amazon CloudWatch and Azure Monitor -- for application-centric cloud monitoring. Organizations with a strong public cloud portfolio will need a range of cloud monitoring tools that not only track application performance, but also ensure security and calculate how efficiently resources are used. Common cloud application metrics include resource availability, response time, application errors and network traffic levels.
A recent iteration of APM relates to applications based on a microservices architecture, which uses APIs to integrate and allow communication between individual services. Such architectures are particularly challenging to monitor because of the ephemeral nature of microservices containers and the emphasis on LAN connectivity and performance. Consequently, microservices applications often rely on what's called "semantic monitoring" to run periodic, simulated tests within production systems, gathering metrics on the application's performance, availability, functionality and response times.
UX monitoring is closely related to APM, but the metrics are gathered from the users' perspective. For example, an application-responsiveness metric might refer to the time it takes for an application to complete a requested web page. If this metric is low, that means the request was completed quickly and the user was satisfied with the result. As the request takes longer to complete, the user is less satisfied.
Regardless of monitoring type, the goal is to answer four essential questions:
- What is present?
- Is it working?
- How well is it working?
- How much resources are being used?
IT monitoring and DevOps
As IT activities transition into a business service, the role of IT monitoring has expanded from an infrastructure focus to include IT processes to ensure that workflows proceed quickly, efficiently and successfully. At the same time, software development has emerged as one of the most important IT processes. Agile and continuous development paradigms, such as DevOps, embrace rapid cycles of iteration and testing to drive software product development.
Rapid cyclical workflows can be rife with bottlenecks and delays caused by human error, poorly planned processes and inadequate or inappropriate tools. Monitoring the DevOps workflow enables an organization to collect metrics on deployment frequency, lead time, change volume, failed deployments, defect -- bug -- volume, mean time to detection/recovery, service-level agreement (SLA) compliance and other steps and missteps. These metrics can preserve DevOps efficiency while identifying potential areas for improvement.
IT monitoring tools used in DevOps environments often focus on end-to-end aspects of application performance and UX monitoring. Rather than simply observe the total or net performance, the goal is to help developers and project managers delve into the many associations and dependencies that occur around application performance. This helps them determine the root of performance problems and troubleshoot more effectively.
For example, it's useful to know that it takes an average of 12 seconds to return a user request. That metric, however, doesn't identify why the action takes so long. Tools monitoring the underlying infrastructure might reveal that web server 18 needs 7.4 seconds to get a response from the database server, and this is ultimately responsible for the unacceptable delay. With such insight, developers and admins can address the underlying issues to improve and maintain application performance.
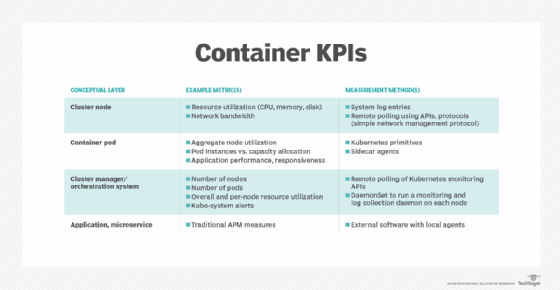
IT monitoring and containers
IT monitoring has also expanded to support virtualized containers, as many new applications are designed and built to deploy in containers. The rise of containers brings a host of container monitoring challenges to IT organizations. Containers are notoriously ephemeral -- they spawn within the environment and last only as long as needed, sometimes only seconds. Containers use relatively few resources compared to VMs, but they are far more numerous.
Moreover, a working container environment involves an array of supporting elements:
- Container hosts.
- Container engines, such as Docker or CRI-O.
- Cluster orchestration and management systems, such as Kubernetes.
- Service routing and mesh services.
- Application deployment paradigms, such as microservices.
Taken together, containers greatly multiply the number of objects that DevOps and IT teams must monitor, rendering traditional monitoring setup and configuration activities inadequate.
Container monitoring involves familiar metrics such as resource and network utilization, but there are other metrics to contend with, including node utilization, pods vs. capacity and kube-system alerts. Even container logging must be reviewed and updated to ensure that meaningful log data is collected from the application, volume and container engine for analysis.
Advanced IT monitoring concepts
Other advances in enterprise IT monitoring include the rise of real-time monitoring and trend/predictive monitoring. Real-time monitoring isn't just a matter of agents forwarding collected data and sending alerts to IT admins. Instead, the goal is to stream continuous real-time information where it can be collected, analyzed and used to make informed decisions about immediate events and assess trends over time. Data is collected from the infrastructure, but with increasingly resilient and distributed modern infrastructures, the data collected from applications can be more valuable to IT staff.
Such monitoring employs a more analytical approach to alerting and thresholds, with techniques such as classification analysis and regression analysis used to make smart decisions about normal vs. abnormal system and application behaviors. Classification analysis organizes data points into groups or clusters, allowing events outside of the classification to be easily identified for closer evaluation. Regression analysis generally makes decisions or predictions based on past events or behaviors. Normal distributions plot events based on probability to determine the mean -- average -- and variations --standard deviations -- also allowing unusual events to be found quickly and effectively.
Classification and regression analysis are also closely related to machine learning (ML) and AI. Both technologies are making inroads in IT monitoring. ML uses collected data to build a behavioral model and then expands and refines the model over time to provide accurate predictions about how something will behave. ML technologies have proved effective in IT tasks such as failure prediction and predictive maintenance. AI and AIOps build on ML to bring autonomy to the ML model and enable software to make -- and respond to -- informed decisions based on dynamic conditions.
Network monitoring poses another challenge. Frequent use of traditional Simple Network Management Protocol (SNMP) communication can be disruptive to busy modern networks, so a type of real-time monitoring called streaming telemetry pushes network operational data to data collection points. This offers better real-time monitoring than SNMP without disrupting network devices.
How to build an effective IT monitoring strategy
A good IT monitoring strategy saves money, conserves limited IT resources, speeds troubleshooting and mitigation and reduces the burden of managing many disparate tools. There are several best practices an organization can build upon to create an overall strategy:
- Reduce or limit the number of monitoring tools. Seek a single-pane-of-glass monitoring environment wherever possible. This works well for relatively homogeneous organizations that use a limited number of systems, architectures, workflows and policies. As one example, a company that does business with just one public cloud provider might use that provider's native monitoring tools along with one or two tools to support the local data center. However, this might be impractical for heterogeneous organizations with broad mixes of hardware, architectures and workflow models.
- Connect IT monitoring with business outcomes. It's easy to deploy so many tools and collect so much data that IT spends vital time and resources watching behaviors and parameters that have no effect on the business. When an IT monitoring strategy starts with a clear perspective on business goals, the subsequent decisions on metrics -- and the tools to gather them -- can be far more deliberate and focused. This will yield results that most directly benefit the business.
- Consider the monitoring approach or focus. There are many ways to approach monitoring that focus on specific areas, such as applications, performance, infrastructure, security, governance and compliance. Each employs different metrics and KPIs. It's possible to embrace several approaches simultaneously, but this requires additional tools and more complex reporting.
- Develop monitoring that closely ties to the application architecture. For example, create a UI for application data using microservices, public cloud, serverless and managed services. This approach is intended for newer application architectures, which can be designed and supported from the ground up; it doesn't work well for legacy or heterogeneous architectures.
- Develop an in-house monitoring environment. One common example is to use log aggregation and analytics tools to create a central repository of operational data, and analyze, report and even predict alerts. This strategy can integrate multiple monitoring tools along with database, data integration, monitoring and visualization tools to create a custom monitoring resource. Be aware that the DIY approach can be time-consuming and expensive to create and maintain.
- Use the data that's collected. Data without purpose is useless. Consider how each metric or KPI will be used. If a metric or KPI isn't needed for a tangible purpose, there's no benefit in gathering and storing that data. Consider how the data will be processed, reported, retained and eventually destroyed according to the organization's data retention policies. If monitoring data isn't included in those policies, it should be. Data should yield meaningful alerting and reporting.
- Adopt an autonomous operations platform. Tools such as Moogsoft, Datameer, VictorOps, Opsgenie and AlertOps use data integration and ML to effectively create a unified monitoring system with a growing level of intelligence and autonomy to help speed IT incident reporting and responses.
Once the strategy is clear, organizations can make more granular choices about implementation approaches and tools. There are plenty of options.
Agents vs. agentless monitoring
This is the process of collecting, processing and reporting data. But which data is collected -- and how -- can vary dramatically. A truly effective monitoring tool sees each target hardware or software object and can query details about them. In most cases, this requires the installation of agents on each object to be discovered and monitored. Although they produce extremely detailed monitoring data, agents must be patched, updated and otherwise managed. They also require processing and network overhead, potentially harming the performance of the object on which the agent operates. Using agents echoes the age-old scientific truism; the act of observing a thing changes the behavior of that thing.
Agentless monitoring foregoes the use of agents and instead collects data through standardized communication protocols, such as intelligent platform management interface, SNMP or services such as interoperable APIs. Agentless monitoring sheds the disadvantages of agents, but the data it collects tends to be limited in quantity and detail. Many monitoring products support agent and agentless data collection.
Reactive monitoring vs. proactive monitoring
This is another expression of real-time vs. trend monitoring. Collection and reporting on real-time statistics and data -- such as processor and memory utilization -- to overall service health and availability is a time-tested, proven approach for alerting and troubleshooting in a 24/7 data center environment. In this approach, admins react to an event once it occurs.
Proactive monitoring seeks to look ahead and make assessments and recommendations that can potentially prevent problems from occurring. For example, if a monitoring tool alerts admins that memory wasn't released when a VM was destroyed, it could help prevent a memory leak in the VM application before the affected server runs out of memory and crashes. Proactive monitoring depends on reactive tools to collect data and create trends for the proactive tool to analyze, and is increasingly augmented with ML and AI technologies to help spot abnormal behaviors and recurring events. For example, if ML detects a recurring rise in application demand or traffic, it can increase resources to the workload automatically to preserve performance and UX without any human intervention.
Distributed applications
Applications that traditionally run in the local data center are increasingly distributed across multiple computing infrastructure models, such as remote data centers and both hybrid cloud and multi-cloud environments. For example, an application might run multiple instances in the public cloud, where ample scalability is readily available, but rely on other applications or data still hosted in the local data center. This adds tremendous monitoring complexity because each component of the overall application must be monitored to ensure that it operates properly.
One key choice in such complex environments is centralization or decentralization. Centralizing collects monitoring data from local and cloud platforms into a single tool to present a single, unified view. This is best to provide end-to-end monitoring across cloud and local infrastructures, although it requires careful integration. By contrast, decentralization continues the use of cloud and local tools without coordination or interdependency. This is simpler to manage and maintain with few dependencies, but organization and analysis of multiple monitoring tools and data sources can be a challenge.
Monitoring and virtualization
Virtualization is a staple of cloud and local data centers and is responsible for vastly improved resource utilization and versatility through software-defined technologies, such as software-defined networks. Monitoring must account for the presence of virtualization layers, whether hypervisors or container engines, to see the underlying physical layer wherever possible. Modern monitoring tools are typically virtualization-aware, but it's important to validate each tool's behavior. Containers are a variation of virtualization technology but share the same need for monitoring and management.
For example, network virtualization divides a physical network into many logical networks, but it can mask performance or device problems from traditional monitoring tools. Proper monitoring at the network level might require monitoring individual VMs and hypervisors, or containers and container engines, to ensure a complete performance picture.
The role of ML and AI
Enterprise IT monitoring involves a vast amount of information. There's real-time data and streaming telemetry to watch for current events and track trends over time, and countless detailed logs generated by servers, devices, OSes and applications to sort and analyze for event triggers and root causes. Many monitoring alarms and alerts are false positives or have no consequent effect on performance or stability. It can be daunting for admins to identify and isolate meaningful events from inconsequential ones.
Consider the issue of anomaly detection. Common thresholds can trigger an alert, but human intervention determines whether the alert is important. Monitoring tools increasingly incorporate AI and ML capabilities, which apply math and trends to flag events as statistically significant and help admins separate the signal from the noise. In effect, AI sets thresholds automatically to reduce false positives and identify and prioritize the most important incidents.
ML also aids anomaly detection in log analytics, a monitoring practice that is particularly effective for root cause analysis and troubleshooting. Here, ML uses regression analysis and event correlation to flag potential anomalies and predict future events and can even adjust for seasonal or daily variations in trends to reduce false positives.
For an example of ML and AI in monitoring, consider the vast amounts of network traffic that an organization receives. Divining an attempted hack or other attack from that volume of traffic can be extremely challenging. But anomaly detection techniques can combine a view of traffic content, behaviors and log reporting to pinpoint likely attacks and take proactive steps to block the activity while it's investigated.
Although ML provides powerful benefits for IT monitoring, the benefits aren't automatic. Every business is different, so there's no single algorithm or model for ML. This means IT admins and software developers must create a model that drives ML for the organization, using a vast array of metrics, such as network traffic volumes, source and target IP address, memory, storage, application latency, replication latency and message queue length. A practical ML exercise might involve Apache Mesos and the K-means clustering algorithm for data clustering and analysis.
Best practices for IT monitoring
IT monitoring is a dynamic process that requires regular attention and support of data monitoring, thresholds and alerts, visualization or dashboard setup and integrations with other tools or workflows, such as CI/CD and AIOps. ML and AI can help to alleviate some of the routine tasks involved, but regular attention is essential to maintain the automated workflows and to validate the evolving ML model.
Consider the simple importance of thresholds in IT monitoring. Monitoring can employ static and dynamic thresholds. Static thresholds are typically set based on worst-case situations, such as maximum processor or memory utilization percentages, and can typically be adjusted from any default thresholds included with the monitoring tool. A static threshold is rarely changed and doesn't account for variations in the environment. It applies to every instance, so it's easy to wind up over- or under-reporting critical issues, resulting in missed problems or false positives.
By comparison, dynamic thresholds generally use ML to determine what's normal and generate alerts only when the determined threshold is exceeded. Dynamic thresholds can adjust for seasonal or cyclical trends and can better separate real events from false positives. Thresholds are adjusted automatically based on cyclical trends and new input. Dynamic thresholds are imperfect, and they can be disrupted when activity occurs outside of established patterns. Thus, dynamic thresholds still require some human oversight to ensure that any ML and automation proceeds in an acceptable manner.
Overall, the best practices for enterprise IT monitoring and responses can be broken down into a series of practical guidelines:
- Focus on the system and apps. There are countless metrics that can be collected and analyzed, but the only metrics that most IT admins should worry about are the metrics related to system -- infrastructure -- and application performance. Everything else is extraneous or can't readily be acted upon by IT. For example, a metric such as cost per transaction has little value to IT teams but might be vitally important to business leaders. Conversely, a metric such as transaction latency might be meaningless to business leaders but can be vital to adequate performance and SLA compliance where IT teams are directly responsible.
- Carefully configure alerts. Thresholds and alerts are typically the first line of defense when issues arise. Direct alerts to the most appropriate team members and then be sure to hold those staffers accountable. Ideally, IT should know about any problem before a supervisor -- or a customer. Integrate alerts into an automated ticketing or incident system, if possible, to speed assignment and remediation.
- Be selective with alerts and reports. Don't overwhelm IT staff with needless or informational alerts. Only configure alerts for metrics that pertain directly to IT operations and turn off alerting for metrics over which the IT staff has no control. This reduces noise and stress, plus it lets staff focus on the most relevant alerts.
- Match people to data. Monitoring is typically a team effort where different staff see and respond to different data. For example, workload owners might need to see application transaction or revenue-related data and reports; IT staff will want to see infrastructure metrics and capacity/performance reporting; helpdesk teams will likely be the front line for alerts. Understand who sees what, and how those responsible individuals will respond.
- Review and update monitoring plans. IT monitoring strategies aren't static entities. Plans are often codified into formal documents, and they need regular updates to keep pace with changing business needs, new tools and evolving regulatory and governance requirements. Review and update the IT monitoring strategy on a regular basis and ensure that the plan meets everyone's needs.
- Consider data retention requirements. IT monitoring can create a substantial amount of data in the form of log files and metrics data streams. All that data is business data and falls under the policies and practices of data security, retention and destruction. Consider the specific retention needs for metrics, KPIs, logs and alerts, and establish data lifecycle management workflows for monitoring data accordingly. Generally, retention for monitoring data is far shorter than typical business data, but the proper management of monitoring data prevents storage sprawl (wasted storage) and strengthens business governance.
- Correlate data where possible. Look for opportunities to combine or correlate data from varied but related metrics. Establishing correlations can help the business find cause-and-effect relationships that enhance observability and might expose opportunities for improvement. For example, a business that sees surges in network traffic to an application and simultaneously notices spikes in server lag and declines in UX have the basis for potential configuration and infrastructure changes. Tools with analytics, ML and AI capabilities can often yield the best results in data analysis tasks.
Important metrics to include in an IT monitoring strategy
There's no single universal suite of metrics suited for all businesses and industries. However, there are some common categories and data points that are typically included in a monitoring plan.
There are five general categories for metrics and KPIs:
- Performance.
- Quality.
- Security.
- Velocity.
- Value.
Each category carries an array of common metrics to consider. Only a small sampling of potential metrics is shown as an example below.
Performance metrics
Performance data indicates the operational state of workloads, services and infrastructure. These are typically most relevant to IT teams and include the following:
- Capacity. The amount of resources used by -- or available to -- a system or application.
- Errors. The number of failed queries or requests -- or other problems -- that occur over time.
- Health. The availability and overall condition of an application or system.
- Mean time between failures. The average time between incidents or failures requiring intervention.
- Mean time to repair (MTTR). The average time needed to mitigate or remediate an incident or failure.
- Response time. The time needed to respond to a query or request -- sometimes termed latency.
- Throughput. The number of queries or requests that a system can handle over time.
Quality metrics
Quality metrics outline and quantify UX. These data points can be useful to business and technology leaders, as well as software developers and workload stakeholders. Factors such as health, errors and failure rates are often part of the quality discussion. Other quality metrics include the following:
- Bug density. The number or rate of defects encountered in a software build or test cycle.
- Escaped defects. The number or rate of defects not detected during the test cycle -- and encountered in later deployment.
- Pass/fail rates. The number or percentage of successful commit-to-build cycles -- often vs. the number or percentage of unsuccessful commit-to-build cycles.
- Throughput. The rate of new builds or the rate at which work is being performed.
- UX. A flexible metric often deduced from other factors such as response time and error rates.
Security metrics
Security metrics are used to quantify issues related to compliance and risk, and can be vital for both IT teams responsible for security, developers creating new code and business leaders responsible for regulatory and governance consequences. Common security metrics include the following:
- Code quality. The assessment of code quality prior to a build.
- Issues detected. The number or rate of security incidents such as detected attacks, bad login attempts, malicious acts blocked and unauthorized changes attempted.
- Mean time to detect vulnerabilities. The average time needed to find a vulnerability in code or infrastructure.
- Mean time to resolve vulnerabilities. The average time needed to resolve a vulnerability in code or infrastructure once detected.
- Number of critical or high vulnerabilities. The number or rate of serious vulnerabilities detected in code or infrastructure.
- Response time. The amount of time needed to respond to and remediate a security incident.
- Scan frequency. The rate of scans for intrusion or other malicious actions.
- Technical debt ratio. The number of software or infrastructure updates or changes delayed -- effectively putting off work until later, creating a "debt" that eventually needs to be met by developers or IT staff.
Velocity metrics
Velocity metrics indicate the speed at which work is being accomplished. Factors such as MTTR and other "mean time" metrics can be related to velocity. Velocity is an indirect gauge of efficiency and is most important to business leaders. Other velocity metrics for infrastructure and development include the following:
- Change volume. The number of changes implemented in a given time, otherwise known as change rate. This might indicate changes to the infrastructure -- such as configuration changes -- but is most often used to report changes to code.
- Completion rate. The number of tickets -- or issues -- addressed and resolved in a given time.
- Customer tickets. The number of change requests or help/issue tickets. "Change" might be related to personnel or infrastructure -- such as onboarding or offboarding an employee -- or bug requests from software users.
- Cycle time. The time needed to complete a development cycle or iteration.
- Deployment frequency. The rate or percentage of tested builds that are deployed to production.
- Resolution time. The time needed to resolve an issue or help ticket.
- Response time. The time needed to address an issue, change or help ticket.
Value metrics
Value metrics are often extrapolated from cost, revenue, velocity and other available data to provide indications of business value and outcomes. Value metrics are typically most important to business leaders and workload stakeholders. Common value metrics include the following:
- Cost. Correlating cost data to other performance, quality and velocity metrics can yield cost data -- and comparative cost-savings data. Common cost variants can include cost-per-user, cost-per-ticket or cost-per-asset, such as the cost of running a server.
- Customer satisfaction. Correlating UX metrics with other business data, such as repeat sales or average spend, can help business leaders gauge the overall happiness of customers and their willingness to do business.
- Customer usage. This is a utilization measure that can indicate a wide range of possible metrics such as time spent on website, using a service or the number of return visits in a given time.
- Lead time. The time needed to implement, deploy or ship.
- Opportunity cost. The estimated value of an opportunity lost vs. the opportunity taken.
- Return on investment. The amount of revenue, or profit, generated from an investment.
- Time to market. The time needed to bring concept to product, or a product or service to market.
IT monitoring tools
IT admins can only act on what they see, and what they see is enabled through tools. Organizations can employ a multitude of tools to oversee and manage infrastructure and services, but tools have various limitations in scope, discovery, interoperability and capability.
An IT team needs a clear perspective on criteria -- What problems are they trying to solve through the use of tools? For example, a business concerned with network performance or traffic analysis needs a network monitoring tool; a tool intended for server monitoring might offer some network insights, but that data likely isn't meaningful enough to be useful.
In the end, an IT staff team faces a difficult decision: deploy a suite or framework that does everything to some extent or use tools from a variety of vendors that provide detailed information but in a pieced-together arrangement that can be hard to integrate, learn and maintain.
This difficult decision is exacerbated by the sheer number of tools available. Tools can be chosen from system vendors, third-party providers or SaaS and other cloud services.
IT monitoring tool examples
The following is only a partial (alphabetical) list of recognized offerings compiled from public research and reporting -- there are countless other tools available to suit almost any business size and need:
- Amazon CloudWatch.
- AppDynamics.
- BMC TrueSight Infrastructure Management.
- Broadcom DX Unified Infrastructure Management.
- Cisco CloudCenter.
- Datadog.
- Dynatrace.
- Google Cloud's operations suite.
- Grafana Cloud.
- Grafana Enterprise Stack.
- Hewlett Packard Enterprise (HPE) OpsRamp.
- IBM Cloud Monitoring.
- Kaseya VSA.
- ManageEngine Applications Manager.
- Nagios XI.
- Microsoft Azure Monitor.
- Microsoft System Center Operations Manager (SCOM).
- NetApp Cloud Insights.
- New Relic.
- Oracle Application Performance Monitoring Cloud Service.
- SolarWinds Network Performance Monitor.
- SolarWinds Server and Application Monitor.
- Splunk Infrastructure Monitoring.
- Veeam ONE.
- VMware Aria Operations.
- Zabbix.
- Zenoss Cloud.
It's important to establish a clear understanding of desired features, capabilities and compatibility before narrowing this enormous field to several possible candidates. At that point, it should be possible to review candidates more closely and implement several proof-of-concept projects to test and validate the tools, along with performance and interoperability in the enterprise environment, before making a final selection for procurement and deployment.
Sometimes, new and innovative technologies offer powerful opportunities for monitoring, optimization and troubleshooting. One example of this innovation is the emergence of log analytics tools. Almost every system produces log files that contain valuable data about events, changes and errors. But logs can be huge, difficult to parse and challenging to correlate, making it almost impossible for humans to find real value in logs.
A relatively new classification of log analytics tools can discover, aggregate, analyze and report insights gleaned from logs across the infrastructure and applications. The recent addition of ML and AI capabilities to log analytics enables such tools to pinpoint anomalous behaviors and even predict potential events or issues. In addition to logs, the ability to access and aggregate vast amounts of monitoring data from other tools enables products such as Grafana or Datadog to offer more comprehensive pictures of what's happening in an environment.
Organizations with a local data center typically adopt some form of server monitoring tool to oversee each server's health, resources and performance. Many tools provide server and application or service management features. Tools include Cacti, ManageEngine Applications Manager, Microsoft SCOM, Nagios, Opsview, SolarWinds Server and Application Monitor and Zabbix.
IT must also decide between vendor-native or third-party monitoring tools. Third-party tools such as SolarWinds Virtualization Manager and Veeam One monitor virtualized assets, such as VMs, and can potentially provide superior visualizations and integrations at a lower cost than native hypervisor offerings, such as Microsoft's System Center 2022 or VMware vRealize Operations 8.0 and later.
Extensibility and interoperability are critical when selecting an IT monitoring tool. Plugins, modules, connectors and other types of software-based interfaces enable tools to discover, configure, manage and troubleshoot additional systems and services. Adding a new plugin can be far easier and cheaper than purchasing a new tool. One example is the use of modules to extend a tool such as SolarWinds for additional IT operations tasks.
Interoperability is critical in building a broader monitoring and automation umbrella, and some tools are rising to the challenge. For example, the Dynatrace AIOps engine now collects metrics from the Kubernetes API and Prometheus time-series monitoring tool for Kubernetes clusters. Ideally, such integration improves detection of root cause events in Kubernetes; more broadly, the implications for integration and IT automation portend powerful advancements for AI in operations.
The ability to process and render vast amounts of infrastructure data at various levels, from dashboards to graphs, adds tremendous value to server and system monitoring. Sometimes, a separate visualization tool is most appropriate. Examples include Kibana, an open source log analysis platform that discovers, visualizes and builds dashboards on top of log data; and Grafana, a similar open source visualization tool, which is used with a variety of data stores and supports metrics.
The shift of infrastructure and applications to the cloud means organizations must track those resources as part of their enterprise IT monitoring efforts. Public cloud providers have opened their traditionally opaque infrastructures to accommodate this, and service providers offer their own native tools for cloud monitoring. The service formerly known as Google Stackdriver -- which has been folded into the Google Cloud Console portfolio -- monitors Google Cloud as well as applications and VMs that run on AWS Elastic Compute Cloud; Microsoft Azure Monitor collects and analyzes data and resources from the Azure cloud; and AWS users have Amazon CloudWatch. Additional options include Oracle Application Performance Monitoring cloud service and Cisco CloudCenter, as well as tools such as Datadog for cloud analytics and monitoring and New Relic to track web applications.
Another major class of IT monitoring tools focuses on networks and security. Such tools can include physical devices and services such as firewalls and load balancers. They watch network activity for traffic sources, patterns and performance between servers, systems and services.
A typical network monitoring tool -- such as Zabbix, Nagios, Wireshark, Datadog or SolarWinds' Network Performance Monitor -- will offer automatic discovery, automatic node and device inventory along with automatic and configurable trouble alerts and reporting. The interface should feature easy-to-read dashboards or charts, and it should include the ability to generate a network topology map.
Virtualization and application awareness enable the tool to support advanced technologies such as network virtualization and APM. Network monitoring can use agents but might not need agents for all devices or applications. Graphing and reporting should ideally support interoperability with data visualization, log analytics and other monitoring tools.
Finally, organizations can use a variety of application and UX monitoring tools, such as New Relic, to ensure application performance and user experience or satisfaction. These tools gather metrics on application behaviors, analyze that data to identify errors and troublesome transaction types and offer detailed alerting and reporting to illustrate application and user metrics, as well as highlight SLA assessments. Others in the APM and UX segments that offer products to assist with monitoring include Datadog, Dynatrace, AppDynamics and Splunk.
Stephen J. Bigelow, senior technology editor at TechTarget, has more than 20 years of technical writing experience in the PC and technology industry.