
spainter_vfx - stock.adobe.com
6 Amazon SageMaker capabilities developers should know about
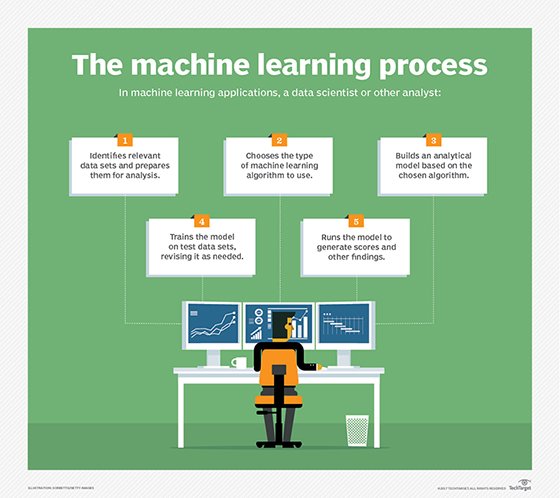
Developers and data scientists should familiarize themselves with these six SageMaker tools meant to simplify the machine learning process. Discover what they offer to your models.

Amazon SageMaker, AWS' flagship AI offering, bills itself as a way to streamline machine learning, but an early version of the service likely left some IT teams wanting.
Developers, analysts and data scientists have used SageMaker since 2017 to build, train and deploy machine learning models in the cloud. The managed service enables users to offload mundane tasks associated with machine learning, but initial releases lacked some of the tools commonly associated with software development, including functionality around debugging, management and collaboration.
In late 2019, AWS addressed several of these shortcomings when it expanded Amazon SageMaker capabilities with SageMaker Studio, Experiments, Debugger and more. This article delves into how these tools work and how they can improve the steps required to take machine learning models from development to production.
SageMaker Studio adds an IDE for AI
This integrated development environment (IDE) simplifies multiple aspects related to building and deploying machine learning models. Most notably, it eliminates the need to select and manage infrastructure for Jupyter notebooks.
SageMaker notebooks provide the option to authenticate using single sign-on (SSO), so teams can use existing company credentials. And developers can share their work -- including the notebook code and its running environment -- with others in their organization. SageMaker Studio's GUI is also user-friendly and offers a consolidated view of these and other features.
SageMaker Experiments targets test and dev work
Developers need to test and iterate through code versions as part of any delivery cycle. In the case of machine learning models, this process is particularly challenging because iterations depend on specific algorithm versions as well as data, models and parameters.
With SageMaker Experiments, developers can group and save the different elements of a particular model's training task. For example, they can track the different models, parameters and data sets so data can be versioned, reproduced and compared.
Once an experiment is created, it can be executed automatically using Experiments' own Python SDK. Developers can programmatically create iterations and start a collection of trial runs, which can be visualized in SageMaker Studio. Given the iterative nature of building and evaluating training models, Experiments can save developers a considerable amount of time.
SageMaker Autopilot recommends and automates model builds
This AWS machine learning tool takes experimentation a step further. It automatically configures and runs iterations based on variables that are selected and configured by SageMaker. For example, Autopilot can choose from a range of algorithms, data preprocessing tasks, instances and parameters to find the most accurate model for a machine learning use case.
Typically, a data scientist would need to manually configure these scenarios and explicitly run different iterations. With Autopilot, developers enter data in columnar format, specify the column to predict and then Autopilot runs iterations to find the optimal model. One limitation to note is that Autopilot currently supports only columnar data.
SageMaker Debugger detects potential errors
With this machine learning feature, developers can better troubleshoot machine learning models. Debugger stores snapshots of models, also known as tensors. These snapshots capture numerous model variables, such as parameters, gradients and other relevant information.
With Debugger, developers can use these snapshots to configure alerts that help them understand where and when their model failed. For example, a rule can be configured to detect whether an output is too large or too small.
Debugger also comes with a set of preconfigured rules. If an anomaly is detected, developers are notified and can troubleshoot the issue by accessing SageMaker Studio's interface and analyzing specific snapshots of their machine learning models. IT teams can use this information to isolate issues that took place at a point in time and with specific conditions. Developers can also react to CloudWatch Events that are triggered by detected anomalies and implement automatic remediation tasks.
When using the SageMaker Debugger feature developers have to instrument their code by adding calls to the Debugger SDK that send tensor data to Debugger at regular intervals. Although the steps are relatively simple, IT professionals do need to be familiar with the SDK and update the source code in their projects before they use Debugger.
SageMaker Model Monitor tracks prediction quality
Once models are deployed in a production environment, it's essential to keep track of any potential anomalies at the application level. Model Monitor is a managed AWS machine learning tool that gathers inputs and outputs in production environments and compares them to model training data. This helps application owners find deviations caused by production data that could have a negative impact on prediction accuracy.
Developers configure Model Monitor to capture requests and responses, which stores the data in Amazon S3. They then create a baseline, which will be used to compare production results against a training environment.
A good practice is to create a baseline from a data set that was used during the model training process and has been confirmed to deliver accurate results. After a baseline is created, developers configure and schedule jobs to monitor endpoints. These jobs use requests and responses from the model deployed in production, and the jobs run these scenarios against the baseline data set.
If production requests no longer generate the expected results observed during training, this can be detected in the outputs from monitoring jobs. These results can be accessed using the SageMaker Studio GUI or programmatically using the SDK. Results can also be published as CloudWatch Metrics, which can be visualized in custom dashboards or trigger CloudWatch Alarms as needed.
SageMaker Processing preps data for analysis
Data scientists can use this AWS machine learning tool to clean data -- including transforming and calculating fields, adjusting column counts, removing noise or standardizing formats -- before it's fed into training or evaluation jobs. SageMaker Processing can also transform data after it has been evaluated.
Developers must use the SageMaker Processing SDK to configure and run processing jobs. Processing tasks -- which can be resource intensive -- are executed in a managed environment, either through SageMaker notebooks or in Docker containers provisioned through AWS' cloud container services.